

Observation Studies
FacilityQuest helps organizations see how their offices truly function, enabling them to make informed decisions about space, design, and investment.
-

What's a Space Observation Study?
Real people walk the floor at regular intervals to capture what’s actually happening:
Which spaces are used (desks, rooms, open areas)
What activities take place (focusing, communicating, collaborating)
The overall energy and mood (calm, tense, energetic)
We then map this data directly onto your floor plans, creating a visual story of how work unfolds in your office.
-
The Result
A clear, evidence-based picture of how your office supports — or hinders — productivity, collaboration, and employee experience.
-
Why It Matters
Most offices don’t perform the way they were designed.
Without data, decisions about space are just guesses.Observation studies uncover:
Which spaces are overcrowded — and which sit empty
How teams actually use space day-to-day
Whether design choices help or hinder productivity
What employees value in their workplace
With these insights, you can stop guessing and start shaping a workplace that supports performance, well-being, and smart investment.
How the Data Helps You
-
Plan Smarter
Know how much space you need and avoid costly guesswork
-
Design Better
Create environments that match how people actually work
-
Allocate Wisely
Put the right teams in the right places
-
Operate Efficiently
Run facilities more smoothly, safely, and cost-effectively
Visualizing the Data
From there, FacilityQuest turns data into decisions:
Heatmaps make activity, noise, and utilization instantly visible
Dashboards & Charts highlight patterns and trends
Actionable Insights cut waste, improve experience, and guide planning
You get clarity, not assumptions — and a workplace that truly works for your people and your business.
Visualizing office utilization over time
Observation Study Process
Route Planning

We start by uploading your floor plan into the FacilityQuest platform and designing a precise observation route. Detailed waypoints ensure full coverage of the space and consistent data collection.
Live Observation

Trained observers walk the floor hourly over a two-week period, recording how each space is used — occupancy, number of people, and activity type. Optional noise readings add an extra layer of insight.
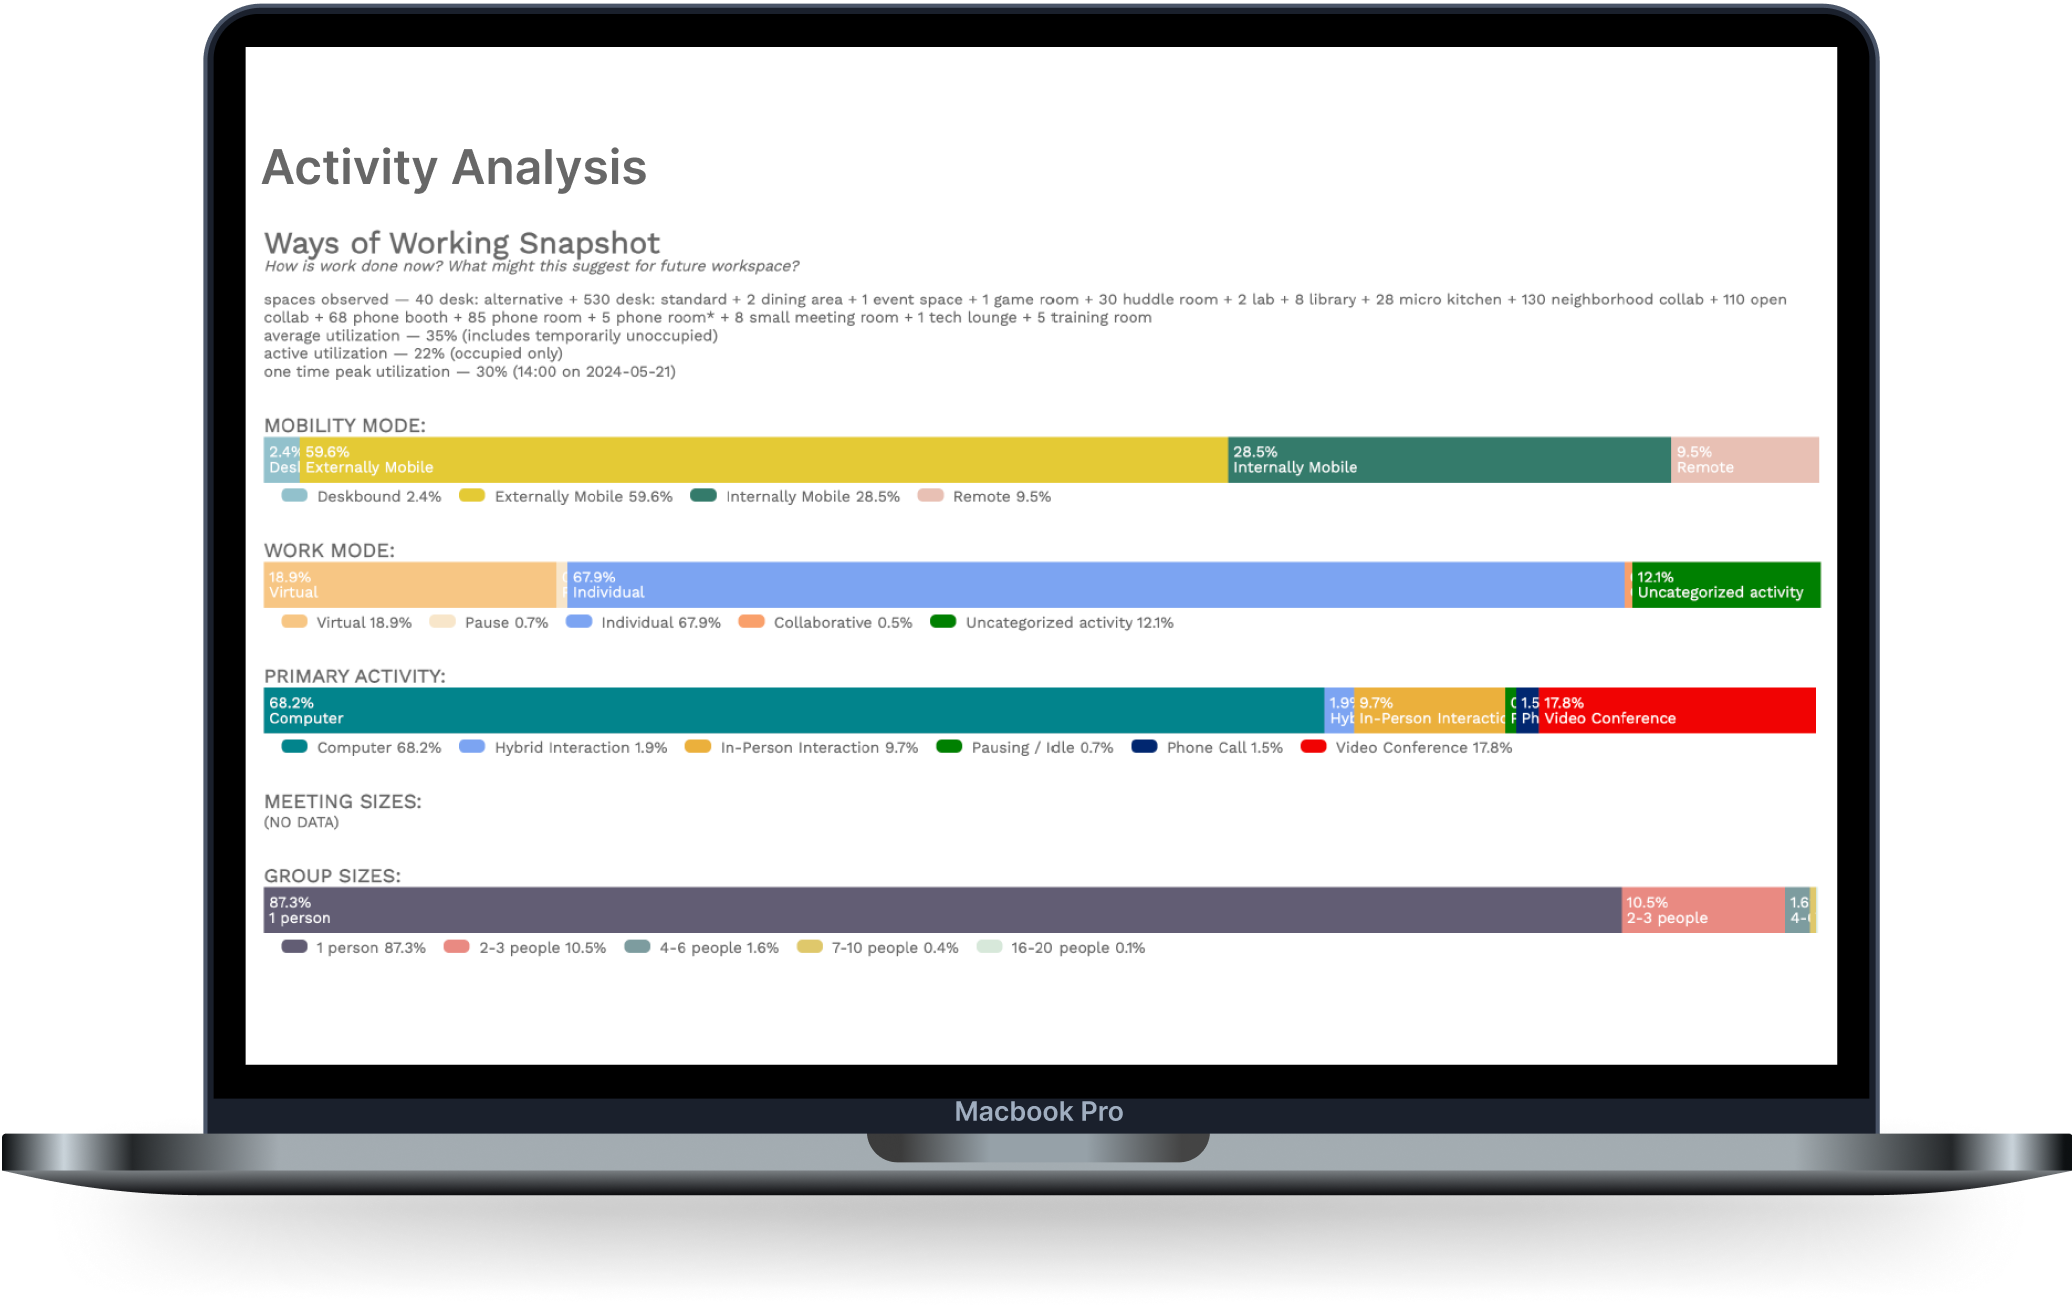
Data Analysis

Once the study is complete, FacilityQuest automatically crunches the numbers, transforming thousands of data points into clear visual dashboards, heatmaps, and utilization metrics.
Workplace Insights

Finally, we extract actionable insights — benchmarking against past studies, highlighting patterns, and pinpointing opportunities to optimize space, design, and operations.

-
Integrated Workplace Analytics
All your data together. One clear view.
-
Noise Metering
Measure sound levels to create healthier, more focused spaces.