
Field Notes: Space Planning for a Coworking Expansion
As the co-owner of a small coworking space near Seattle, we are constantly shifting the positions and locations of desks as well as eyeing other space in the building that we might be able to expand into. When my partner and I embarked on creating a proposal to our landlord, we had a number of hurdles.
By Leslie Schneider

Quick Test Fits Provide Data for Scenarios Development
As the co-owner of a small coworking space near Seattle, we are constantly shifting the layout and locations of desks as well as eyeing other space in the building that we might be able to expand into. In addition to coworking, the building we are in hosts four restaurants and some movie theaters as well as a few other office and retail spaces. We’ve called this building our business home for almost 10 years now, since 2011. A year ago we had to shut our doors for about 6 weeks due to Covid, and we have been under various restrictions since then.

1. This floor plan was imported as an iPhone photo via the Genius Scan app.
2. In FacilityQuest we drew the green line (upper right, in the “Event” room) because we knew that dimension and therefore could use that line to set the scale for the entire plan.
3. Eight purple rectangles covered the full existing OfficeXpats Coworking space. We tagged them as “Main” and got a quick square foot total area.
A new urgency is emerging from requests and questions about the availability of private offices in our space. We’ve had the goal to provide enclosed offices for a few years, but never pulled the trigger on a new commitment; the few rooms that we had we preferred to offer as reservable meeting rooms. Now it seems vital. For health, as well as business. Even in a post-pandemic world.
Private offices in a coworking space have special requirements to justify their higher cost compared to any locked door space in a commercial building. Coworking is about community and shared resources. Someone who rents space in coworking wants visibility into liveliness. Connected to activity. Not just a locked door in a blank wall.
When my partner and I embarked on creating a proposal to our landlord, we had a number of hurdles.
A small problem was that we had access to some floor plans, but how to digitize them easily without a large scale scanner?
Then, how to graphically overlay on the outdated floor plans our ideas for various scenarios for space planning, knowing that those ideas would probably be modified with counter proposals from the landlord? Many graphics programs would offer general layering, but could we easily manage the scale of the markup?
And then there was the problem of turning drawings on a map into a business plan and an offer for new leased space. We needed to know how much space as square feet we were getting ourselves into. It was not obvious from a floor plan that only had a few inside wall dimensions.
We had a secret weapon. I also work for a company called FacilityQuest. For a little longer than I’ve been nurturing my coworking space, FacilityQuest has been in the business of “large scale space utilization data gathering.” Architecture companies would use our software-as-a-service to perform one or two-week observation studies on hundreds of spaces for clients anticipating big decisions.
But I knew that FacilityQuest would also be perfect for my very different data-gathering-idea-generating-decision-making space management task. I could import a floor plan and overlay rectangular markup that could define areas. Those rectangles had a superpower: I could set the scale on the floor plan, and then any rectangle would also know how many square feet it represented. And I could link these areas by tags, such as “enclosed-office,” to immediately see the sum of all related areas.
But first, how to import that awkward, oversized floor plan? It was only 11x17, but too big for the many normal-page-size scanners that I had access to. So I took a photo of it with my phone using the app Genius Scan to automatically optimize the contrast and clean up stuff like shadows. After uploading it into FacilityQuest you would have to look closely to see a tiny hint of the fold line.
Then I played with drawing new enclosed offices, calibrating the rectangles to the scale of the floor plan, adding tags, and seeing the cumulative area. We repeatedly changed dimensions of the offices to try out different test fit options. We printed these sketches for tenant improvements and showed them to the landlord.

And then of course, the landlord had a different long-term goal for the space we proposed, so our tenant improvements for that space would have to wait for a comprehensive re-design. We went back to the drawing board, um, I mean the floor plan. Round 2, we focused on acquiring existing enclosed offices that did not require tenant improvements as an interim plan.
The story on negotiations is still not over, but we now have a flexible system for creating new scenarios. The underlying intelligence of those scenarios is understanding the exact relationship between the cost of supply (our cost per square foot of usable space plus triple net plus added percent of common space) and the price we can charge for the demand (membership fees for dedicated offices with specific sizes).
On top of all that, FacilityQuest has long offered us the ability to organize data about our spaces by dropping blue-dot pins on the floor plans. Like the tags on markup areas, data associated with those blue dots gets summarized, so we know how many dedicated desks and unassigned desks we have, and can track data associated with our meeting rooms.
FacilityQuest is looking for pilot projects that expand the horizons of use for FacilityQuest. If you would like to work with us on this or other uses, we encourage you to apply. Here is an article that offers more information.
Trusting Data for Ongoing Workplace Iteration
A year since the Covid-19 lockdowns began in earnest, organizations are faced with numerous choices.
By Chris Diming, PhD - Applied Anthropolgist
A year since the Covid-19 lockdowns began in earnest, organizations are faced with numerous choices. The pandemic has accelerated the adoption of remote working for “knowledge workers” and others doing certain tasks. With that comes a reaffirmed desire by those who can work remotely for flexibility and the potential benefits of working from home for achieving harmony between “work” and “life.” The emerging consensus surrounding hybrid work, a workplace arrangement combining remote working and office working through technology, opens the door to new possibilities for aligning people, technology, and space with the work being done.
However, with such possibilities also comes uncertainty. The Covid-19 pandemic’s trajectory remains as winding as ever due to concerns over the potential for an additional surge, the vaccination rate, and global access to vaccines. Will there be an unexpected rise in cases, and would it affect workers’ return to the office?
Additionally, what will be Covid-19’s long-term impacts on workplaces and workers? Will employees return to the office and use facilities as expected, or will they initially be reluctant to gather in-person? Furthermore, will employees’ experience with remote working’s benefits prompt them to stay home?
Thus, the pandemic’s winding trajectory has meant that, with such possibility also comes great uncertainty. It can seem daunting to design a post-pandemic workplace when so much is unknown.
However, fog does not necessitate paralysis. Neil Usher, Chief Workplace and Change Strategist with GoSpace AI, emphasizes in his recent book, Elemental Change, that workplace practitioners should focus their efforts on finding opportunities to shape future behaviors, rather than relying solely on data from the past or present. The workplace becomes a testbed for experimentation, with successive iterations capitalizing on lessons learned and exploring possible avenues.
Therefore, although today’s workplace professionals have a lot on their plate, it is possible to move forward. However, to do so, they will need all the tools at their disposal. Harnessing qualitative and quantitative workplace data can be a powerful tool for unearthing opportunities for innovation. Utilization scores, occupancy metrics, and traditional surveys uncover behavioral patterns, while interviews and observations conducted with employees delve into what happens underneath.
Workplace data can provide a critical foundation for iteration. Access to it allows strategists, planners, facility managers, and others tasked with figuring out work to base their conclusions on empirical facts, thereby granting a crucial degree of certainty amid uncertainty.
In January and February 2021, we conducted primary research with professionals in workplace strategy, design, facilities management, and space planning. A California-based workplace planner we interviewed explained that, because of how his colleagues work from home, it is impossible to know how spaces will be used after they are designed. Therefore, he asked, “How do I design when I don’t know who the actual end-user is going to be?”
Rather than take a “wait and see” approach, the planner instead advocates for conducting pilot projects to iterate new environments. For many participants, doing so involves the use of data to create scenarios and project future space requirements. Clients, internal stakeholders, and other collaborators often expect the practitioner to come to the table with possible outcomes of what may happen if certain design decisions are taken over others.
However, the data must be trustworthy. It is within this context that a UK-based design strategist explains, “[there] is this need for being able to model and simulate an answer. Future is critical…so…modeling is part of that. The question of course is where the data is coming from. But assuming that we have the data, the ability to model, simulate and do scenarios is valuable.”
Hitting the point home, a planner in the US mainland illustrates how he came up with the figures needed to estimate space requirements and present answers to stakeholders. Lacking a source of reliable utilization data, he makes do with headcount estimates from recruitment and meetings booked in Google Calendar. However, he is ultimately unsure whether he can trust the data. Thus, he says, “I go through the calendars and…essentially plug in how often they use [meeting rooms] to create utilization rates… but I don't know how accurate those numbers are to be fully honest, because those meetings could have been cancelled.”
Harnessing data for planning and scenario generation is a crucial tool for workplace professionals to operate on a day-to-day basis. However, workplace professionals need to trust the data they have. Our research shows that this certainty is not always the case.
Our research tells us that data accuracy is a crucial issue facing workplace practitioners during and after the Covid-19 pandemic. Therefore, we are exploring how we can help by leveraging our technology to foster certainty in data. To do so, we are embarking on a series of pilot studies with organizations and professionals who may use our services. Will you join us on our journey to reimagine workplace data and innovate the Future of Work?
Injury and Hazard Mapping in the Workplace
If hazards can be identified and mapped as a proactive measure to prevent injuries, then data about actual injuries should also inform the relative risks for health and safety in a workplace. Analyzing locations with a history of more injuries than other areas should point to the culprit hazards. Focusing the data on specific types of injuries (e.g. back pain) or certain levels of injuries (e.g. injuries that cause missed days of work) will also establish a priority for addressing hazards.
Hazard maps are gaining momentum as helpful visualizations of health and safety problems overlaid on a map of the environment they exist in. These visualizations communicate patterns of hazard concerns by providing important spatial or geographical context. Historically, hazard maps have been created for earthquake or weather disaster preparedness. Hazard mapping for health and safety issues in a workplace environment is starting to leverage this best practice, and is the focus of this article.
Workplace hazard mapping is increasingly cited as an effective tool for workers participating in gathering information about the hazards which affect their health and safety. Workers who participate can gather knowledge about hazards from their co-workers. For a workplace hazard map, a team of employees might perform a risk assessment of the work environment and then annotate floor plans to document what they found. A picture is worth a thousand words. The map or floor plan visually communicates—with context—where hazards exist.
Map Injuries too!
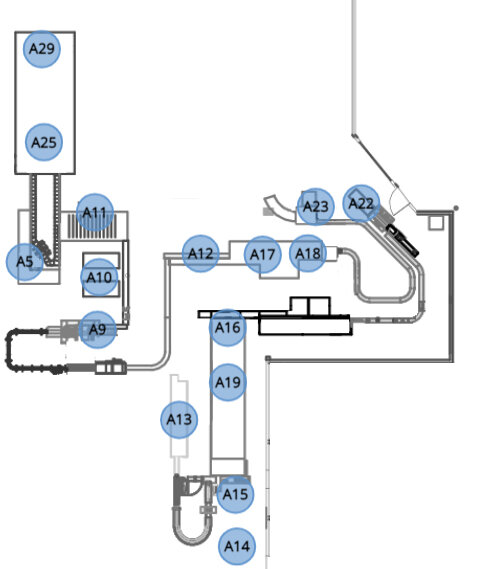
The blue dots are pins on the map that hold injury data.
If hazards can be identified and mapped as a proactive measure to prevent injuries, then data about actual injuries should also inform the relative risks for health and safety in a workplace. Analyzing locations with a history of more injuries than other areas should point to the culprit hazards. Focusing the data on specific types of injuries (e.g. back pain) or certain levels of injuries (e.g. injuries that cause missed days of work) will also establish a priority for addressing hazards.
In the fall of 2020 FacilityQuest was contacted by the environmental health and safety (EHS) department of a food products company asking whether the heat maps we generate for utilization data could also represent incidents of injuries. The “heat” of colors to represent concentrations of injuries would add a new layer of context to hazards mapped on floor plans. We took on the challenge.
The mapping challenge was easy. We were provided with floor plans and a spreadsheet of data about the injuries that was exported from their Environmental Health and Safety (EHS) incident management software. The data on each injury listed a location, so we worked with the EHS liaison to place dots (like map pins) on the floor plans to document each of the locations. We made some minor UI/UX customizations to show the full list of injuries, make it searchable, and to present the subset of injuries for any given location just by clicking on the location dot.

The color of the dots indicates the concentration of injuries at the location. Red is the highest concentration; gray shows identified hazards but with no injuries. (Note that this detail of a floor plan does not represent the full allocation of injuries.)
Visualizing the “Heat” of injury Concentrations
Then came the interpretation of the data to see a heat map of the injuries. We leveraged our existing technology for showing “intensity of utilization” at any given workplace location. We came up with an algorithm for how to choose colors to represent different levels of concentration.
The heatmap result highlights the concentration of injuries. There will be fewer red locations than any other color because of the higher number of injuries in each location. Orange will identify the next highest density of injuries and will therefore have the next lowest number of locations. Yellow and blue colors highlight the most locations indicating the lowest concentration of injuries. Gray indicates identified hazards with no injuries.
Analyzing Subsets of Injuries
But, you may be thinking, not all injuries are created equal. The job of a heat map is to focus attention on concentrations of injuries, but our attention may also want to discern whether the data comes from common injuries such as burns, cuts, and bruises, versus injuries that may result in workers compensation or disability claims. While hazards for all injuries need to be addressed, we need to differentiate minor injuries from those that result in days when the employee could not work.

The fields from the imported spreadsheet are shown on the left, representing categories (attributes) of injuries. Data about the highlighted field shows on the right. FacilityQuest then aggregates the number of records to show counts of injuries for each category.
Injury data on a floor plan probably includes levels of severity or coding for different types of injuries. Those that cause serious harm need to be looked at separately from those that are treated with first aid, or even those that are close calls but with no actual harm done.
Injury Type
Searching for specific injury types also limits what is shown on the floor plan, therefore resulting in better comparisons and analysis. So for instance, by searching (filtering) the data by “cause of injury” to show “slips and falls,” the color-coded dots on the floor plan represent only slip-and-fall injuries.
Incident Level
The data we imported had 5 incident levels. By filtering/searching for injuries categorized as “First aid” for instance, the concentration by color of the injuries on the floor plan also changes. Another example for analysis is to restrict what is shown on the floor plan to just the injuries that are required to be reported (recordable).

In addition to injuries sustained on-site, employers often collect data associated with near-accidents and near-misses. And accidents may or may not result in an injury. This was the case for the food products company we worked with. So by limiting (filtering) the data for incident levels with no actual injuries, the heat map can show concentrations of hazards as well.
SEEING INJURY INCIDENTS OVER TIME
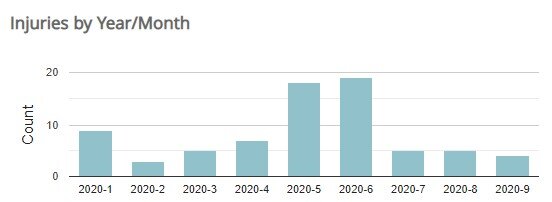
Seeing injuries over time is important to understanding if baseline safety measures are effective, or if progress is being made by specific mitigation efforts. Paying attention to injury data in real time also draws attention to new spikes or rising trends. These alerts should trigger research into emerging issues that might be driving injuries.

To support this knowledge base, we added an EHS dashboard and created analytics that examine patterns, rate changes, and trends over days of the week, or by shifts, time of day, season, or year-over-year. Just as the heat map can select for injuries by type or severity level, these analytics can isolate subsets of data.
Sources of Hazard and Injury Data
Hazard data is usually by direct observation of the work environment through a workplace inspection. Inspections can be conducted on a routine basis, or following an injury incident to identify causes. Because of their familiarity with the work environment, workers are good sources of environmental health and safety risk information.
FacilityQuest users can leverage work flow originally developed to collect utilization (occupancy) data but instead to gather data on hazards. Walking around with the FacilityQuest app on a tablet device can enable a “hazards mapper” to report their observations, either by following a designated route, or to add new points of interest for hazards.
Injury data too can be logged directly with the FacilityQuest web app. A company that doesn’t already have an EHS system might choose to maintain their primary EHS data using FacilityQuest.
If FacilityQuest is used as a secondary source of injury/hazard data for purposes of mapping and showing “heat” concentrations, periodic updates from the primary source will keep the data current. To update the EHS data from the food products company, we repeated the import of the injury data to FacilityQuest.
And finally, a hybrid system might allow for direct entering of hazard data in FacilityQuest while importing injury data from systems that specialize in reporting that is required by Occupational Safety and Health Administration (OSHA).
Challenge Us With Your Workplace Data
FacilityQuest has evolved over the last decade, starting with expertise in collecting data for space utilization analysis and expanding to managing desk assignments and tracking inventory to people or spaces. Visualizing hazards and injury data was a natural next step.
You too could send us a floor plan or two and a spreadsheet of data. Let’s see what it turns into.
Or maybe you see something in your workplace that needs some visual context. Turn to us as workplace data experts. Data visualization creatives. Work flow enablers. Contact us and challenge us.
Manage the Workplace for People
Whether it’s creating a safe environment for people in a Covid pandemic, or creating a flexible environment for a fluid post-Covid world, FacilityQuest offers a management solution that doesn’t over-complicate managing. With too many details or complex workflows, the management tool will get sidelined. Getting the right mix of fast, simple, and meaningful is where FacilityQuest excels: visual and mobile tools to keep track of an agile workplace and manage it effectively.
Whether it’s creating a safe environment for people in a Covid pandemic, or creating a flexible environment for a fluid post-Covid world, FacilityQuest offers a management solution that doesn’t over-complicate managing. With too many details or complex workflows, the management tool will get sidelined. Getting the right mix of fast, simple, and meaningful is where FacilityQuest excels: visual and mobile tools to keep track of an agile workplace and manage it effectively.
Desk Management
It starts with floor plans. Not perfect floor plans! Whatever you have will work. Technically, that could be a photo of a sketch of your layout on the back of a napkin (so far, no one has actually tried that though). The important differentiation is that the floor plan is for spatial reference, not for exact representation of the current status.
Then start layering information with place markers that define your spaces. Drag blue dots around and add some markup to annotate. Now add people to those spaces, incrementally, or with an import.
Planning for People by Department
Assign people to a space (e.g. a desk or office) and a department. Spaces too can be assigned to a department. But what if not all people in those spaces are from the same department? Spaces get allocated for many reasons, and flexibility or availability are some of them.
In the image below, the department Client Services has 19 unassigned seats and is hosting 6 guests. One can see for planning purposes which departments have capacity, with spaces that have not yet been assigned. Likewise, it’s easy to see spaces that have been assigned to “guests” or which department employees do not have assigned spaces with their peers. Guests might be employees from another department, or they might be interns or contingent staff. Unassigned spaces might also be resources dedicated to a department, such as focus rooms or meeting rooms. These details become obvious when you see the spaces highlighted on a floor plan.
Show People; Find People
Two views of your people data are side-by-side: a list of data in the People Panel, and names (or initials) of people on the floor plans. Search in the People Panel by name, department, or tags and find them highlighted on a floor plan. In the picture below, a search on this floor plan by a department name highlights two people in the lower left.
Move People to New Assigned Spaces
To move people around, just drag-and-drop people from one space to another space. The move can either take place immediately or is planned for a future date. Desk sharing is supported: more than one person may be assigned to a single space.
People Information and Assets
Assets assigned to people are tracked and accessed by either the Panel list or from the floor plan.
Assets assigned to people can be tracked by department:
Change Workplace Density
In an environment with fast changing pandemic realities, policies on how many people can return to the workplace and where they can get work done is likely to evolve as well. With a quick calibration setting, you can create a rule for minimum proximity--such as 6’--then run a report that shows how many spaces are out of compliance with that rule. Tweak the rule and rerun the report to show how different scenarios play out.

Manage the Workplace for People!
Let FacilityQuest help you build the new normal for the safety and comfort of your people. Take the guesswork out of occupancy planning, asset assignment, and capacity and proximity compliance. Centralize all spreadsheet data and PDFs and give your data visual context. Walk around with a tablet to make data updates as you see changes. Use client support services at FacilityQuest to avoid the learning curve. You’ve got this.
Manage Assets in FacilityQuest
FacilityQuest helps you plan, track, and document your spaces, people, and assets… all with minimal investment in time or training. Let’s dive in and discuss how you might use FacilityQuest to manage assets.
FacilityQuest is a space planning and space management solution for workplaces. Especially in times of accelerated change, FacilityQuest helps you plan, track, and document your spaces, people, and assets… all with minimal investment in time or training.
To dive in with more specifics, let's discuss how you might use FacilityQuest to manage assets:
How to acquire and create a catalog of assets
How to keep track of where or to whom they have been assigned
How to find them on a floor plan!
Create a Catalog of Assets
In fitting with the FacilityQuest model of starting wherever you are and building up information as you go, you could start by importing assets information from a spreadsheet. From there you would assign specific assets to spaces or people on your floor plans. From here on out, manage your catalog of assets in FacilityQuest.
Or, if you don’t have a list of assets already, decide what’s important to track and then start by simply adding basic names and descriptions of them to the blue dots for spaces (or green dots for people). Your assets catalog grows with these “notes,” but you might notice inconsistencies in the way that data was entered… not a problem. At any time, use a shortcut tool (like “search and replace” only better) to make the data more consistent. And add information that may not have been captured initially.
Assign Assets to a Space

A blue dot defines and anchors information about a space, whether it’s an enclosed room or an open lounge, or a specific area within a larger space.
In one scenario, you assign and track assets to a space. Such assets could include furniture such as an ergonomic chair, or fixtures such as a moveable whiteboard, or equipment such as a shared printer.
To backtrack for a moment, a space is defined when you place a blue dot on your floor plan as a link to information about that space. A “space” can be an area such as an open lounge, or a room such as an enclosed office, or a space within a room or area, such as a coffee bar. It’s up to you and what you care to document and manage.
These blue space dots link to information such as the space type: “workstation”, or “focus room”, or “team room”. Often the blue dot information also shows that a space belongs to a department or a business unit. And it might note what floor the space is on, or what building it's in. Spaces can also hold information such as the capacity, or the area square footage. Spaces can have photos to document what it looks like and how it is used.
And of course, the space can have a list of assets assigned to it. Just like spaces and people, assets have their own panel to allow searches and browsing. Anything selected or in search results gets highlighted in the floor plan view.
In the example above, the asset “Connect 36 Chromebook Charge Cart” is selected in the far left Assets panel, which then highlights the space it is assigned to on the floor plan (see the red dot on “Learning Center). Inspecting (double-clicking) the asset brings up the Learning Center space info and shows other assets also assigned to Learning Center.
Assign Assets to a Person
In a second scenario, you can assign and track assets such as a laptop to a person. In the screen below, the search results for “justin'“ brings up two assigned assets and highlights Justin Loye on the floor plan.
The visual connection from an asset in a list to where it belongs on a floor plan is as natural to do as it sounds: click on an asset to highlight either the person or space it belongs to on the floor plan. In the Asset panel below, the search for “laptop” brings up a sizable list, and highlights all the people on the floor plan who are assigned one.
The search for “Recorder” brings up just one person who has been assigned a Voice Recorder Pro, and that person (as we now already know), Justin Loye, is highlighted on the floor plan.
Reporting
All this data about assets shows up not just when you inspect individual spaces or people, but is also grouped on a dashboard. So when you assign an asset to a space, you can then track and report on how many assets are assigned in total to a space type such as "meeting rooms." Or, see a list of assets that belong to a specific department.
Assets that are assigned people as well as spaces can roll up to a category such as departments, so you can quickly get a clear picture of not just who has what stuff, but what stuff a department is allocated.
This is just a brief introduction to integrating information about assets into your space planning and management. We didn’t get to other options for reporting, or importing and exporting for example. Give us a chance to hear what you need and we’ll walk you through the relevant scenarios. Click here to get our attention.
Before you go…
All management tools in FacilityQuest are anytime/anywhere accessible via a secure web app, on desktops, laptops, and mobile devices, to layer places, people, and assets on floor plans. Upload floor plan PDFs; annotate floor plans with drawing tools that calculate area; define spaces; assign people to spaces; assign assets to people or spaces. Take photos while walking around with an internet-connected tablet that automatically upload to a defined space.
It really is that straightforward, but we don't expect you to do it all on your own right from the start. We get you going fast by assigning a staff consultant to your subscription; a real person who understands the history with your project.
Other modules available in FacilityQuest include:
An employee survey unit. Manage change and build trust by engaging with employees using a unique SMS texting survey (employees answer questions about their work environment, wherever they work, with photos and notes).
A space utilization unit. Gather utilization data to track mobility trends and prove/disprove perceptions about use of space, to optimize the workplace for employee productivity, or plan for the next lease. Utilization data shows that space could deliver more value when put to a different use.
Give us a call or click here to send us a message and we’ll be happy to answer your questions or take you for a quick spin.
Look before you leap: new trends in space utilization studies
A full scale utilization study for a large workplace can get pricey when you have a team of temps being paid to walk around collecting data for a week or two. This article explores how some companies are getting actionable data that drives their decision making without the big investment.

Let’s say you are expected to use occupancy or utilization data for a pre-design phase of a workplace, but that’s not your sweet spot. You might be thinking, “Uh, does that mean sensors? What might we learn from the data? Do I have to be a data analyst to figure it out? How much is this going to cost? It sounds like a management nightmare.”
Don’t start with sensors
Most utilization studies do not use sensors. However, if your workplace has them already installed and if you have access to the data, use that data! Companies like FacilityQuest that already work with space utilization data can probably help you analyze it.
But sending real people into the workplace to gather observations-based data for 1-2 weeks is currently the best practice for utilization studies because observers gather data that goes beyond just occupancy. Information such as “how many people are doing what activities in what types of spaces.”
For instance, “Temporarily unoccupied” means that there is an appearance of the space being used—someone left their stuff behind—even though no one is actually there. Additionally, data can be gathered on what equipment is being used and what secondary activity is also happening in the space, e.g. “people eating lunch while also having a meeting.”
Sensors and other automated data can still play a role, however. More on that to come.
Learn how space performs as-used vs. as-intended

To re-emphasize Point number 1, you learn “how many people are doing what activities in what types of spaces.” Example: conference rooms might have high occupancy, but by only one person more than half the time, even for rooms with a capacity of 10+. Workstations might be 95% assigned but 30% of them are empty for the entire day more than three days a week. Those learnings can figure into the programming for the next office space design. That data can help persuade decision makers to embrace your big ideas.
No statistical Analysis skills required
Depending on the tools you use, good reporting can make utilization data visual and digestible such that you can ask good questions and draw the right conclusions. And at FacilityQuest you also get help from real people. In a utilization study, the reporting phase includes a Q&A with an architect specializing in workplace strategy who guides you through the results and helps to digest the results. This allows you to dig deeper for more insights. It’s about your curiosity and appetite for seeing a result and asking “why.” The story-telling about key findings and design outcomes is what you bring to the table.
Options for Reducing Cost and Logistics

A full scale utilization study for a large workplace can get pricey when you have a team of temps being paid to walk around collecting data for a week or two. Let’s now entertain a few trending choices that some companies are making to get actionable data that drives their decision making. When appropriate, these options significantly reduce the costs and logistics for a utilization study. We’ll refer to these options collectively as “pulse” utilization studies because they share the attribute of “less is more.”
Traditional Space Utilization Studies
For comparison, a traditional space utilization study calls for ‘full coverage data’ in order to get optimal statistical understanding of utilization. Typically, this has been defined as observers documenting the activity in each space eight times per day, five days per week, for 1-2 weeks (i.e. 40 data points per space per week). This data shows the highs and the lows, the good-bad-and-ugly, whenever they occur. Typically these studies are staffed with temps.
Alternative: Measure Peak Utilization Only
Contrast traditional data gathering with a pulse study where the hours and/or days to measure utilization are cherry-picked to measure only peak utilization. Measuring peak means you want to know the ‘worst case scenario’ of demand of space resources, and it also implies a willingness to miss out on some aspects of how space is used in order to achieve a specific goal.
By planning for peak, you recognize that your spaces will be underutilized at other times of the day or other days of the week, but you have confidence that your new design will accommodate the highest expected use. You also have data to show that you are not squandering resources for ‘beyond peak’.
The payoff can be lower cost, flexible logistics, or spreading the investment to multiple surveys that measure the impacts of change over time. We’ll get into how this is done, but first, a few more options to consider.
Alternative: A Pilot Study in a Test Area
Another variation on a pulse study is to survey a smaller selection of spaces and then extrapolate the results from that sampling to the larger workplace. A small pilot project could study a test area, such as a prototype of a new neighborhood layout, so that the patterns of utilization in the new space can be understood before rolling out similar designs to other groups or offices.

While the extrapolation carries the risk of over-representing a certain result, many re-designs don’t make the investment in space utilization at all, so some data is better than no data.
And, if a larger study is being considered, starting with a limited study in order to understand the value of the results is a valid way to prove the concept before committing to a larger investment. A pulse study could simply be a pilot, or a phase 1, “Let’s try it out,” with a possible deeper dive to follow as needed. The pilot study creates the road map to a fuller understanding of the full scope of the workplace.
At the conclusion of the pilot, everyone on the team understands the process of data gathering and the value from the data. At that point, you may be ready to move to the next area to get another set of “surgical” results, or you may decide to move forward with a full-coverage traditional survey. Or you may decide to repeat the study again in six months to see what changes. And of course you may decide the takeaways from the pilot data are satisfying enough--or justifies what you already know--and you are now confident to move forward with your recommendations for the design phase.
Alternative: Limit the Scope to specific space types
And finally, you could pick a priority such as choosing to study only conference rooms to keep an initial project manageable without the cost and logistics of bringing in temporary staff. If you are only being asked for your recommendations on size and number of collaboration spaces, no need to gather data on assigned workstations.
Using Internal Staff as Data Gatherers

The choice to measure fewer spaces or only during peak hours means that internal staff could be designated as part-time data gatherers. For a peak study, these internally assigned observers walk around gathering data with a tablet on a designated route, but only at the start of four peak-use hours, let’s say at 10am, 11am, 2pm, and 3pm. They might spend 10-20 minutes per hour to complete their routes.
One person can observe 50 spaces in 10-15 minutes (and even faster after a short ‘getting used to it’ training period). So one person spending a total of one hour per day (split across four peak hours) could provide valuable insight into 50 or more spaces! Compare that to the cost and logistics of hiring a temp to do the same job full time for a week or more. And an internal person performing the data gathering is familiar with the space, so training is minimal.
EXAMPLE: A Global Set of Pulse Studies
In Q2 of 2019 a global tech company decided to survey eight of its corporate campuses worldwide to get a measure of peak utilization. They chose the busiest three days of the week and observed during the the peak hours of 10am, 11am, 2pm and 3pm.
This company has been measuring utilization in different ways for over a decade and had experience in analyzing badge (building access) data that could show which days of the week had the highest number of employees on premises. Interestingly, the peak days of the week were not the same across campuses, so for this company, guessing the peak days would have set a poor foundation for trusting the results.
Takeaways from the 8-campus pulse surveys:
It was easier to remotely manage the internally sourced observers. The chosen observer--typically the facilities manager who already knew their way around--was a familiar face, so there was no need to prepare employees for unknown observers doing unfamiliar work. There was no need to grant temporary access to the space. And the assigned observer could do other ‘normal’ work between passes and thus avoid down time when they became efficient at taking data.
Utilization rates were on average higher than our typical project, although this was impacted by how the project chose to look at workstations as clusters rather than as individual seats.
If there was a "bad" day (e.g. the assigned observer got caught in a meeting), less data was gathered. And because only peak hours were being measured, missing a few hours of data had more impact on the project. However, observers were generally flexible enough to take "extra" data the next day or the following week to make up for missing routes.
EXAMPLE: A Meeting Rooms Study
Utilization projects may answer an initial question, but lead to additional questions about how the workplace is being utilized. In a recent very small study measuring just meeting rooms and collaboration spaces, the office manager set up the survey and then performed all the observations for the week (the workplace strategist didn’t even get involved until the results were in.
It was unique and refreshing that the same person involved with the goals of the study was also the one gathering the data and included in discussing the results. In this case, the study showed that 78% of the time the meeting spaces were utilized by 1-2 people, even though the rooms were built to accommodate 4-6+ people. This led to client to question how collaboration and individual work was happening in the rest of the work space, and what might motivate this pattern of use.
Key Takeaways
The takeaway from the trend of “pulse” studies might just be another truth of the 80/20 rule: some data is so much better than no data. Dashboards light up with some data as brightly as they do with lots of data. If the results of a small sample are not trusted enough for a high-stakes decision, the exercise can be repeated at a larger scale and with more confidence due to the ‘dress rehearsal.’
What version of ‘starting small’ makes sense in any given situation? As with any business challenge, it depends on the problem are you trying to solve. Here’s a list of a few of them, and let us know what else might benefit from limited utilization studies.
|
The Problem to Solve |
Traditional
|
Gather
data for |
Gather
Data for |
Pilot project |
|
Must have statistical confidence in data, e.g. to be used for permanent CRE decisions |
X |
|
|
|
|
Decision timeline offers limited window to gather data |
|
X |
X |
X |
|
Workplace security concerns restrict data gathering to internal staff only |
|
X |
X |
X |
|
Validation of other utilization data, such as badge or Wi-Fi |
|
X |
X |
|
|
Limited inquiry, such as analyzing conference room use |
|
|
X |
X |
|
Proof of concept for testing logistical feasibility or evaluating results |
X |
|
X |
X |
All of the ‘problems to solve’ listed above are flavors of limitations that relate to time, money, or managing complexity. So the interesting outcome of this innovation is that these challenges are addressable and may put space utilization and occupancy data within the reach of more projects.
Day-in-the-life of a space utilization study
FacilityQuest performed a two-week utilization study for a well known tech company in one of it’s European offices. A utilization study gathers data about "how many people are doing what activities in what types of spaces." This study covers 14 floor plans in three locations. We've never before told the space utilization data gathering story as it unfolds day-by-day!
Day One of #ProjectSatisfaction

FacilityQuest began a two-week utilization study for a well known tech company in one of it’s European offices. A utilization study gathers data about "how many people are doing what activities in what types of spaces." This study covers 14 floor plans in three locations, and we're very happy to have our partner MovePlan taking good care of the ten observers over the two weeks of the study.
We've never before told the data gathering story as it unfolds day-by-day, but this project might be a good one to try it on. Stay tuned for more updates in the next two weeks. To help track this story, we’re code naming this #ProjectSatisfaction, since Keith Richards laid down one of the greatest pop hooks of all time.
The graphic on the right is the setup for one floor of a utilization study, with the blue dots overlaying a floor plan to represent observation points, and red lines as visual markup to indicate the walking path. The blue dots also contain data about the space, such as space type, room identifiers, department/building information, capacity, and more. Observers walk the space with an iPad or other tablet and take data about the activity going on in the space. As the data accumulates, you can start to see statistics on how many people doing what activities in each space type.
Day One is a training day, a route validation day, and an adjustment day. We walked the routes to make sure they matched what we assumed from the floor plans. A few adjustments were made. Observers on this project were re-shuffled a bit between routes, and they generally out-performed expectations. By the second or third hour, consistency and efficiency was achieved.
Day Two of #ProjectSatisfaction

This observations dashboard shows that the temp workers have hit their groove and are now very efficient. So efficient that some are asking for more to do, and we asked one observer to take test data in an open cafe area not originally part of the study.
The colors in the grid below map to the observers, and floating over any colored cell offers who, when, how many, and average time per observation. “Mark” is on both Route A and Route C, with a lot of consistency. Route E is being shared with two observers each taking every other hour.
Interestingly, multiple observers have told us what a beautiful space it is, how nice it must be to work here, how friendly the staff is, and how this company seems to really care about their employees. I guess that’s also what workplace strategists want to hear!
Day Four of #ProjectSatisfaction
Yes, we skipped Day Three. Lots of good data was gathered.
For Day 4 (a Friday) we’re taking a mid-stream look at data coming in to see how enclosed meeting rooms are used. Often, companies want to see a comparison of how the SUPPLY of enclosed meeting spaces is meeting the DEMAND of the group sizes that use them. In the data story below, we see how many of what size meeting rooms are available (the SUPPLY), and compare that to the size of groups that meet.
SUPPLY
The “supply” of meeting rooms is derived from static data, i.e. information for each observation point that doesn’t change from hour to hour. This data is usually part of the setup of a utilization project, but it can also be validated and updated on site. Floor plans sometimes get out of date, don’t they?

This is a breakdown of the supply of meeting rooms, shown as a percent of more than one hundred enclosed meeting spaces observed.
DEMAND By Size of Meetings (as observed anywhere)
When “meetings” happen, how many people are in those meetings? Note that “Meeting” is an observed primary activity, and this perspective on DEMAND shows all meetings wherever they happen, and not necessarily in enclosed meeting rooms. But that also means that when only one person is observed in a meeting room, it isn’t usually tagged as a “meeting.” Therefore, the 3% of 1-person meetings were observed as virtual online meetings.

This is a breakdown of all activity tagged as “Meeting”, regardless of where it was observed.
DEMAND By Group Size observed in enclosed meeting rooms
Important question: what is considered a meeting room? Would a “training room” also be used for meetings? We don’t know yet, so what you see below is a best guess from an outsider’s perspective. But for this example, we excluded phone booth rooms and phone pods. So, “40% of enclosed meeting room space used by 1 person” means that either the phone booth rooms were filled, or people preferred to camp out in meeting rooms to get their individual work done.

For all activity observed in enclosed meeting rooms, this shows the breakdown of group size, regardless of room capacity.
By looking at these three analytics, what else would you want to know about meeting space demand that would impact decisions for changing up the supply? Ask us. There are so many good questions.
Day Five of #ProjectSatisfaction
Monday, is now sealed and delivered, which completes a full five days since the project started after a Monday holiday last week. But we still have a week to go!
A few more adjustments: One observer called in sick this morning, so we quickly shuffled the routes to re-allocate. An observer named Michelle requested to switch routes just to get a change of environment. Ellie kindly agreed to swap with her and they both completed their new routes averaging 3.8 seconds or less. This is fast! They are getting very good at reading floor plans while taking data.

A new route gets added on the fly to capture behavior around a stairwell during and after meetings.
Lean in to lunch: The observers have become so quick (and thus finishing routes with significant time to spare) that we decided to collect data through the lunch period. This gives the client information on where and when staff are taking their lunch break.
On-the-fly experiment: After noticing some interesting behaviors in and around the core stairwell of the building, we added yet another short route to capture the patterns. People were stepping out of meetings to take phone calls, and it looked as if groups were forming “post meetings” to close out meetings that needed more time. Our observer Olivia has been documenting the types of behaviors and interactions in this space and making thorough notes. Also, instead of following the dots numerically (letting the software advance to the next space), she touches the dots according to where the interactions are happening. Interestingly, we’ve brainstormed scenarios for this “inverted” method of taking data in recent weeks, so I’m curious to see how the new data story takes shape.
Make hay when the sun shines: This should close up Monday on a happy note… sunshine is causing a lot more activity out on the terrace, so we extended the café route on the 5th floor to capture the sun seekers.
Day Six of #ProjectSatisfaction

A snapshot preview: aggregated observations of activity over the length of the study so far can be seen as colors representing percent ranges of utilization.
Tuesday, day 6 saw the sun still shining! One of our observers is a Yoga instructor and had the idea of involving the team in a Yoga session in the park today at 2.30pm between surveys. How’s that for a revitalizing break! Also we did another quick shuffling of routes when an observer had to leave early today for an appointment.
Wi-Fi reliability: We had a few issues with the Wi-Fi recently, resulting in observations data not uploading immediately and automatically when the route is finished. We are prepared for this, and it happens more frequently than one might imagine. Even though the FacilityQuest app is software-as-a-service (available via a website), the data gathering mode is fully expecting to be in a non-connected stand-alone environment. Data remains safely on the device for as long as needed. Only damage to the device itself (or unavailability, if the device is stolen, for instance) is a threat for lost data. We train the on-site point person to check all devices at the end of the day for any remaining data that needs uploading. But in fact, the data for the entire length of the survey would be safe if no Wi-Fi was available, even at the end of the day.
Heat maps: We took a peek at some of the very initial data presented as “heat,” i.e. showing the utilization in colors on the floor plans based on the aggregated utilization. While the colors and data ranges they represent are dynamically adjustable, our default defines blue as the least utilized (under 30%), yellow is between 30-49%, orange is 50% - 69% and red is the highest (over 70%). It’s also fun to scroll through the hours to see how it changes over the course of the day; maybe we’ll show that a bit later on.

A new experimental route, added just a day ago, already shows some interesting patterns of utilization in an area intended as circulation space (not designed to support work or collaboration).
Remember the new route created to track activity around a stairwell, outside of a bunch of conference rooms? Here it is with just one day’s worth of data. Those red hot spots are pretty impressively utilized for a space that is not intended for gathering or working. However, because this is an experiment, and because the data is being captured when activity is noticed (not once per hour, as in the rest of the study), it is not an applies-to-apples comparison with other routes. That said, each observed activity is time-stamped, and can be analyzed separately to glean an understanding of this unique space.