
Injury and Hazard Mapping in the Workplace
Hazard maps are gaining momentum as helpful visualizations of health and safety problems overlaid on a map of the environment they exist in. These visualizations communicate patterns of hazard concerns by providing important spatial or geographical context. Historically, hazard maps have been created for earthquake or weather disaster preparedness. Hazard mapping for health and safety issues in a workplace environment is starting to leverage this best practice, and is the focus of this article.
Workplace hazard mapping is increasingly cited as an effective tool for workers participating in gathering information about the hazards which affect their health and safety. Workers who participate can gather knowledge about hazards from their co-workers. For a workplace hazard map, a team of employees might perform a risk assessment of the work environment and then annotate floor plans to document what they found. A picture is worth a thousand words. The map or floor plan visually communicates—with context—where hazards exist.
Map Injuries too!
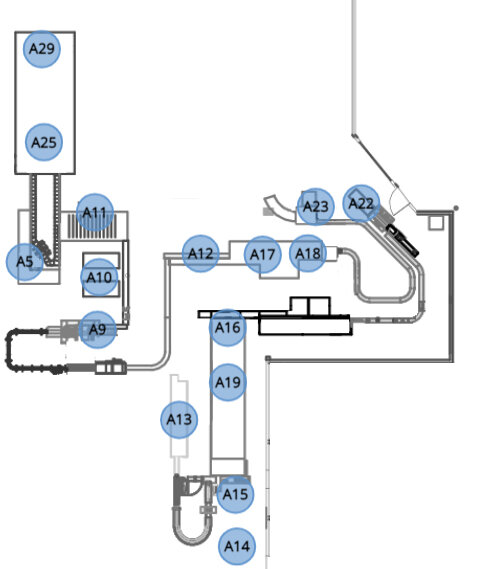
The blue dots are pins on the map that hold injury data.
If hazards can be identified and mapped as a proactive measure to prevent injuries, then data about actual injuries should also inform the relative risks for health and safety in a workplace. Analyzing locations with a history of more injuries than other areas should point to the culprit hazards. Focusing the data on specific types of injuries (e.g. back pain) or certain levels of injuries (e.g. injuries that cause missed days of work) will also establish a priority for addressing hazards.
In the fall of 2020 FacilityQuest was contacted by the environmental health and safety (EHS) department of a food products company asking whether the heat maps we generate for utilization data could also represent incidents of injuries. The “heat” of colors to represent concentrations of injuries would add a new layer of context to hazards mapped on floor plans. We took on the challenge.
The mapping challenge was easy. We were provided with floor plans and a spreadsheet of data about the injuries that was exported from their Environmental Health and Safety (EHS) incident management software. The data on each injury listed a location, so we worked with the EHS liaison to place dots (like map pins) on the floor plans to document each of the locations. We made some minor UI/UX customizations to show the full list of injuries, make it searchable, and to present the subset of injuries for any given location just by clicking on the location dot.

The color of the dots indicates the concentration of injuries at the location. Red is the highest concentration; gray shows identified hazards but with no injuries. (Note that this detail of a floor plan does not represent the full allocation of injuries.)
Visualizing the “Heat” of injury Concentrations
Then came the interpretation of the data to see a heat map of the injuries. We leveraged our existing technology for showing “intensity of utilization” at any given workplace location. We came up with an algorithm for how to choose colors to represent different levels of concentration.
The heatmap result highlights the concentration of injuries. There will be fewer red locations than any other color because of the higher number of injuries in each location. Orange will identify the next highest density of injuries and will therefore have the next lowest number of locations. Yellow and blue colors highlight the most locations indicating the lowest concentration of injuries. Gray indicates identified hazards with no injuries.
Analyzing Subsets of Injuries
But, you may be thinking, not all injuries are created equal. The job of a heat map is to focus attention on concentrations of injuries, but our attention may also want to discern whether the data comes from common injuries such as burns, cuts, and bruises, versus injuries that may result in workers compensation or disability claims. While hazards for all injuries need to be addressed, we need to differentiate minor injuries from those that result in days when the employee could not work.

The fields from the imported spreadsheet are shown on the left, representing categories (attributes) of injuries. Data about the highlighted field shows on the right. FacilityQuest then aggregates the number of records to show counts of injuries for each category.
Injury data on a floor plan probably includes levels of severity or coding for different types of injuries. Those that cause serious harm need to be looked at separately from those that are treated with first aid, or even those that are close calls but with no actual harm done.
Injury Type
Searching for specific injury types also limits what is shown on the floor plan, therefore resulting in better comparisons and analysis. So for instance, by searching (filtering) the data by “cause of injury” to show “slips and falls,” the color-coded dots on the floor plan represent only slip-and-fall injuries.
Incident Level
The data we imported had 5 incident levels. By filtering/searching for injuries categorized as “First aid” for instance, the concentration by color of the injuries on the floor plan also changes. Another example for analysis is to restrict what is shown on the floor plan to just the injuries that are required to be reported (recordable).

In addition to injuries sustained on-site, employers often collect data associated with near-accidents and near-misses. And accidents may or may not result in an injury. This was the case for the food products company we worked with. So by limiting (filtering) the data for incident levels with no actual injuries, the heat map can show concentrations of hazards as well.
SEEING INJURY INCIDENTS OVER TIME
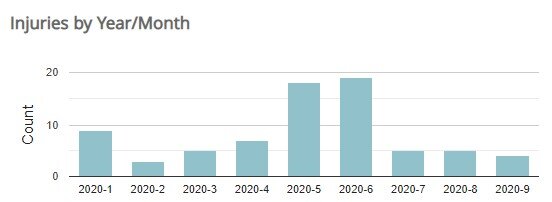
Seeing injuries over time is important to understanding if baseline safety measures are effective, or if progress is being made by specific mitigation efforts. Paying attention to injury data in real time also draws attention to new spikes or rising trends. These alerts should trigger research into emerging issues that might be driving injuries.

To support this knowledge base, we added an EHS dashboard and created analytics that examine patterns, rate changes, and trends over days of the week, or by shifts, time of day, season, or year-over-year. Just as the heat map can select for injuries by type or severity level, these analytics can isolate subsets of data.
Sources of Hazard and Injury Data
Hazard data is usually by direct observation of the work environment through a workplace inspection. Inspections can be conducted on a routine basis, or following an injury incident to identify causes. Because of their familiarity with the work environment, workers are good sources of environmental health and safety risk information.
FacilityQuest users can leverage work flow originally developed to collect utilization (occupancy) data but instead to gather data on hazards. Walking around with the FacilityQuest app on a tablet device can enable a “hazards mapper” to report their observations, either by following a designated route, or to add new points of interest for hazards.
Injury data too can be logged directly with the FacilityQuest web app. A company that doesn’t already have an EHS system might choose to maintain their primary EHS data using FacilityQuest.
If FacilityQuest is used as a secondary source of injury/hazard data for purposes of mapping and showing “heat” concentrations, periodic updates from the primary source will keep the data current. To update the EHS data from the food products company, we repeated the import of the injury data to FacilityQuest.
And finally, a hybrid system might allow for direct entering of hazard data in FacilityQuest while importing injury data from systems that specialize in reporting that is required by Occupational Safety and Health Administration (OSHA).
Challenge Us With Your Workplace Data
FacilityQuest has evolved over the last decade, starting with expertise in collecting data for space utilization analysis and expanding to managing desk assignments and tracking inventory to people or spaces. Visualizing hazards and injury data was a natural next step.
You too could send us a floor plan or two and a spreadsheet of data. Let’s see what it turns into.
Or maybe you see something in your workplace that needs some visual context. Turn to us as workplace data experts. Data visualization creatives. Work flow enablers. Contact us and challenge us.