

Injury Mapping
FacilityQuest turns workplace incidents into actionable insights.
See Where Injuries Happen
Accidents aren’t just numbers on a report — they happen in real places, at specific times, for specific reasons. FacilityQuest’s Injury Mapping tool moves safety tracking beyond spreadsheets by pinpointing incidents directly on your floor plan.
Injury events are mapped by location and time, creating a clear visual history that lets safety teams identify hot spots, track trends, and verify that remediation efforts are working.
See where risks live. Act where it matters most.

-
The Results
A clear picture of where risks are concentrated, so leaders can identify danger zones, change practices, and move forward with confidence.
Why It Matters
Traditional reporting captures what happened, but not where it happened.
By adding location context, you gain a deeper understanding of:
Injury hot spots – areas with repeated incidents
Patterns and causes – what types of injuries occur, and why
Severity profiles – from minor slips to major accidents
Time trends – when incidents are most likely to occur
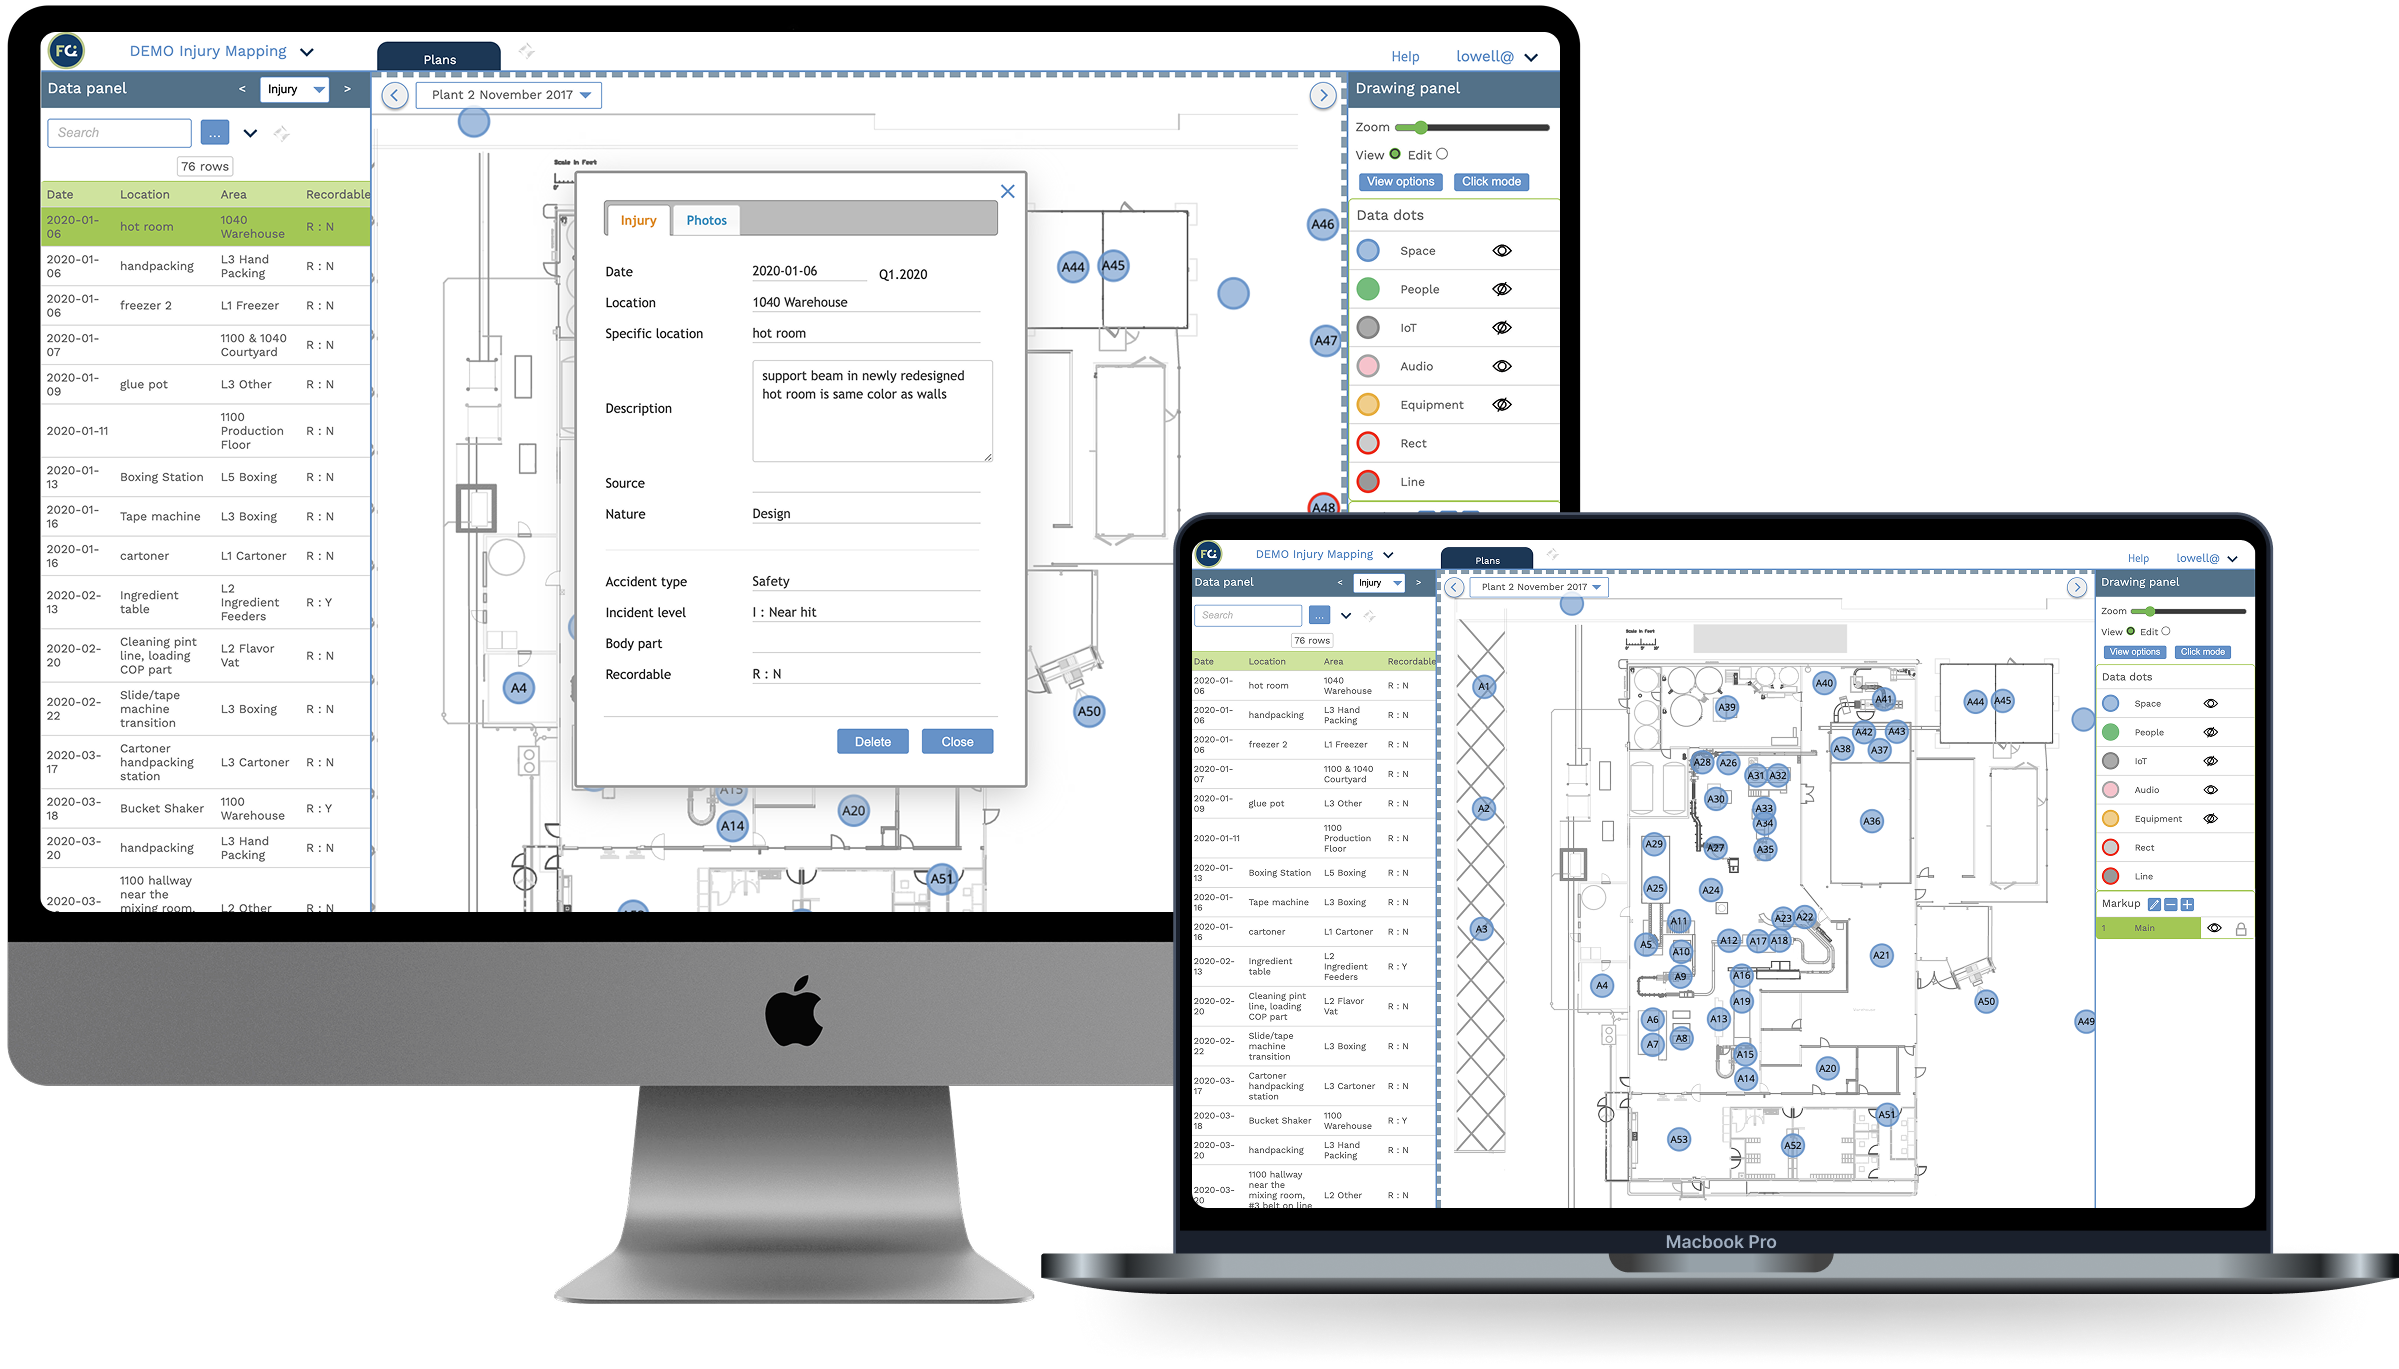
How It Works

Log the incident in FacilityQuest or your existing system—either way details flow seamlessly into FacilityQuest.

Plot the incident directly on your floor plan.


Record the Incident
Map the Location
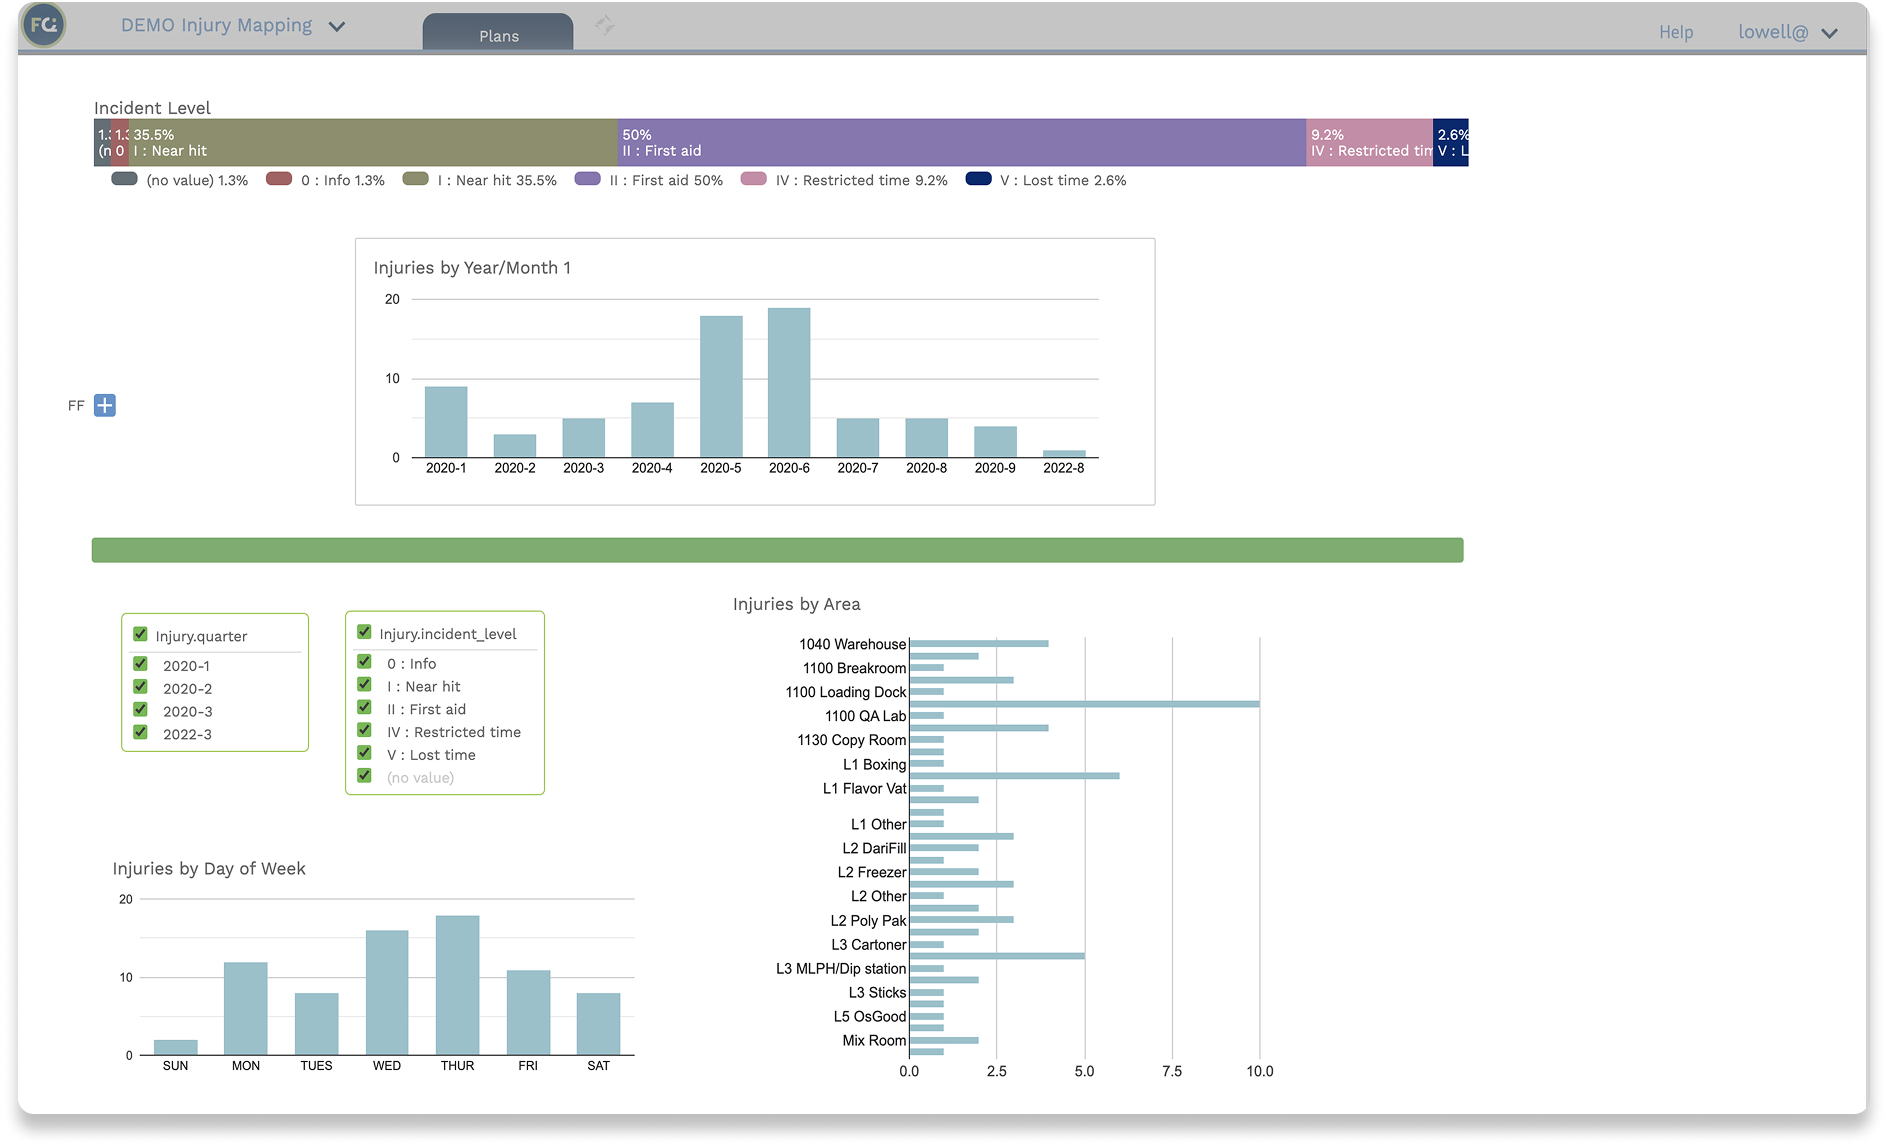
Analyze the Data
Use visual dashboards and heatmaps to spot risks and trends.
Take Action
Prioritize remediation and monitor results over time.
Who Benefits?
-
EH&S Leaders
Understand root causes and demonstrate compliance.
-
Facility Managers
Identify design or maintenance issues driving incidents.
-
Plant & Warehouse Managers
Reduce downtime and improve employee safety.
-
Executives
Monitor risk reduction efforts and ensure ROI on safety investments.
Injury Mapping = Safer Workplaces
By combining detailed incident data with location intelligence, FacilityQuest gives organizations the clarity to:
Reduce injuries and related costs
Create safer, more productive environments
Build employee trust and confidence
Measure and prove the impact of safety initiatives
Time-lapse floor plan with injury heatmap
-
Story Snaps
Give employees a voice in shaping their workplace.Description goes here
-
Asset Management
Know what’s where — and keep it that way.