

Noise Metering
Hear What Your Space is Really Saying
Turn Sound Into Actionable Insight
Workplaces are designed with intent — quiet zones for focus, lively zones for collaboration, and everything in between. FacilityQuest’s Noise Metering service helps you understand if those spaces are performing the way they were meant to.
Using hand-held sound meters (not recording devices), our observers take decibel readings throughout the workplace. No privacy concerns, just clear, objective data.

-
Why It Matters
Noise levels can make or break productivity, health, and employee experience.
By capturing real data, you can:
Verify whether spaces are working as designed (e.g., is the library actually quiet?)
Identify areas where noise may pose a health or safety risk
Detect patterns that impact focus, collaboration, and satisfaction
Inform workplace design and operational strategies with evidence
How It Works
Measure

Noise levels can make or break productivity, health, and employee experience.
Correlate

Noise data is paired with occupancy and activity data for deeper insights.
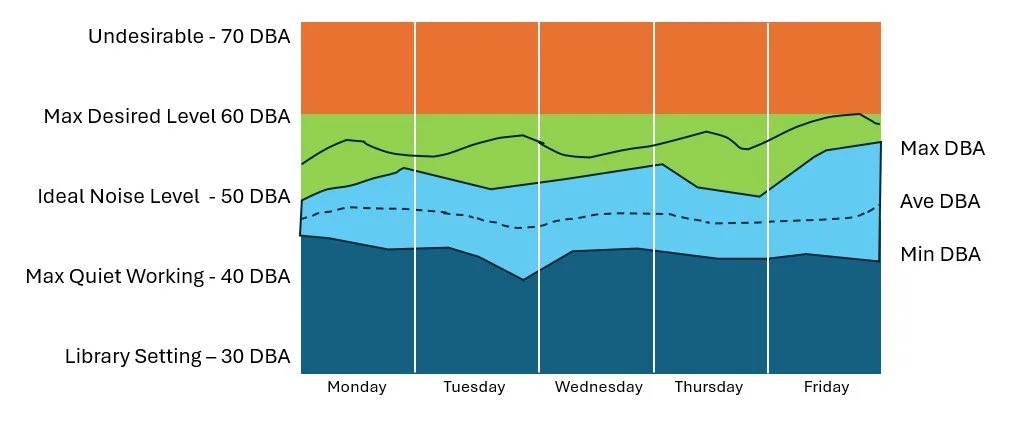
Visualize

FacilityQuest creates heatmaps and dashboards to show noise distribution over time.
Act

Use insights to adjust layouts, acoustics, and operational practices to better support your teams.

The Value
Objective measurement — not guesswork.
Privacy-safe data collection — no audio recordings, ever.
Actionable intelligence — combine noise, activity, and occupancy data to get a complete picture.
Better workplaces — design and operate spaces that truly support how people work.

Noise Level Guide
| dB Range | Label | Typical Environment / Activity | Notes |
|---|---|---|---|
| 0–15 dB | Silent | Library at night, soundproof booth | Ideal for deep focus |
| 15–35 dB | Whispered | Quiet reading area, small huddle room | Low distractions |
| 35–55 dB | Quiet / Normal Conversation | Open office with etiquette, lounge space | Comfortable for most knowledge work |
| 55–70 dB | Lively | Open collaboration zones, café, team standups | Good for energy, may disrupt focused tasks |
| 70–85 dB | Noisy | Active workshops, events, crowded cafeteria | Prolonged exposure can affect concentration and comfort |
| 85–100 dB | Damaging | Mechanical rooms, construction zones | Use hearing protection |
| 100+ dB | Hazardous | Heavy machinery, concerts, emergency alerts | Hearing loss risk |
Understanding noise levels is key to creating spaces where people can focus, collaborate, and feel comfortable. This guide helps you interpret what different decibel readings actually mean — so you can see how your workplace compares to the environments people experience every day
FacilityQuest Noise Metering helps you create environments where people can think, collaborate, and thrive — without turning up the volume.
-
Observation Studies
See how your spaces are really used.
-
Story Snaps
Give employees a voice in shaping their workplace